File:TetrationAsymptoticExpansion00.jpg: Difference between revisions
Jump to navigation
Jump to search
imported>Dmitrii Kouznetsov |
imported>Dmitrii Kouznetsov |
||
| Line 1: | Line 1: | ||
== Summary == | == Summary == | ||
{{Image notes ownworkpro | {{Image notes ownworkpro | ||
|Description=plot of deviation of holomorphic tetration from its asymptotic expansion at large values of the imaginary part of the argument. (Real part of the argument is | |Description=plot of deviation of holomorphic [[tetration]] from its asymptotic expansion at large values of the imaginary part of the argument. (Real part of the argument is assumed to have moderate values). | ||
Tertation tet is solution of equations | |||
<math>\mathrm{tet}(z\!+1\!)=\exp\big(\mathrm{tet}(z)\big)</math> | |||
<math>\mathrm{tet}(0)=1</math>, holomorphyc in the complex plane except the cut at the part of the real axis. | |||
At large values of the imaginary part of the argument, tetratiomn can expanded asumptoticaly, | |||
<math>\mathrm{tet}(z)=\sum_{n=0}^N a_n \varepsilon^n + \mathcal(O)\!\big(\varepsilon^{N\!+\!1}\big)</math> | |||
where <math>\varepsilon=\varepsilon(z)=\exp(L z +R) </math> ; | |||
<math>L\approx 0.2+1.3\mathrm{i}</math> is [[fixed point]] of logarithm, | |||
and <math>R\approx 1.077961437526 -0.946540963949 \mathrm{i}</math> is universal constant. | |||
First coefficients are: | |||
<math>a_0=L</math>, | |||
<math>a_1=1</math>, | |||
<math>a_2=\frac{1/2}{L-1}\approx -0.151314 - 0.2967488 \mathrm{i}~,~</math> | |||
<math>a_3=\frac{a_2+1/6}{L^2-1}\approx -0.36976 + 0.98730 \mathrm{i}</math><br>, | |||
The four pictures show the deviation of [[tetration]] from the approcimation at | |||
<math>N\!=\!0</math>, | |||
<math>N\!=\!1</math>, | |||
<math>N\!=\!2</math>, and | |||
<math>N\!=\!3</math>; id est, | |||
<math>f=\mathrm{tet}(z)-\sum_{n=0}^N a_n \varepsilon^n</math>. | |||
The distribution of <math>f</math> in the complex <math>z</math>-plane is shown with lines | |||
of constant phase and lines of constant modulus of <math>f</math>. | |||
:Levels <math>|f|=\exp(-0.8),\exp(-0.6),\exp(-0.4),\exp(-0.2)</math> are shown with thin red lines. | |||
:Levels <math>|f|=\exp(0.2),\exp(0.4),\exp(0.6),\exp(-0.8)</math> are shown with thin blue lines. | |||
:Levels <math>|f|=\exp(3), \exp(2), \exp(1),\exp(0), \exp(-\!1), \exp(-\!2), \exp(-\!3), \exp(-\!4), \exp(-\!5), \exp(-\!5), \exp(-\!7), \exp(-\!8)</math> are shown with thin thick black lines. | |||
:Level <math>|f|=\exp(-10)</math> is shown with thick red line. | |||
:Levels <math>|f|= \exp(-12),\exp(-14), \exp(-16),\exp(-18)</math> are shown with thick black lines. | |||
:Level <math>|f|=\exp(-20)</math> is shown with thick red line. | |||
:Levels <math>|f|= \exp(-22),\exp(-24), \exp(-26),\exp(-28)</math> are shown with thick black lines. | |||
:Level <math>|f|=\exp(-30)</math> is shown with thick green line. | |||
:Level <math>|f|=\exp(-31)</math> is shown with thick black line. | |||
The plotter tried to draw also the lines | |||
:Level <math>|f|=\exp(-32)</math> with thick black line and | |||
:Level <math>|f|=\exp(-33)</math> with thin dark green line, but they happened a littel bit scratched. | |||
In the upper left corner of the last two pictures; the plotter could not distinguish the tetration from its asymptotic approximation. | |||
|CZ username= Dmitrii Kouznetsov | |CZ username= Dmitrii Kouznetsov | ||
|Year created= 2008 | |Year created= 2008 | ||
Revision as of 00:29, 7 December 2008
Summary
Template:Image notes ownworkpro
Licensing/Copyright status
Template:CC-by-nd-3.0 Template:CC-image
File history
Click on a date/time to view the file as it appeared at that time.
| Date/Time | Thumbnail | Dimensions | User | Comment | |
|---|---|---|---|---|---|
| current | 19:57, 11 March 2022 | 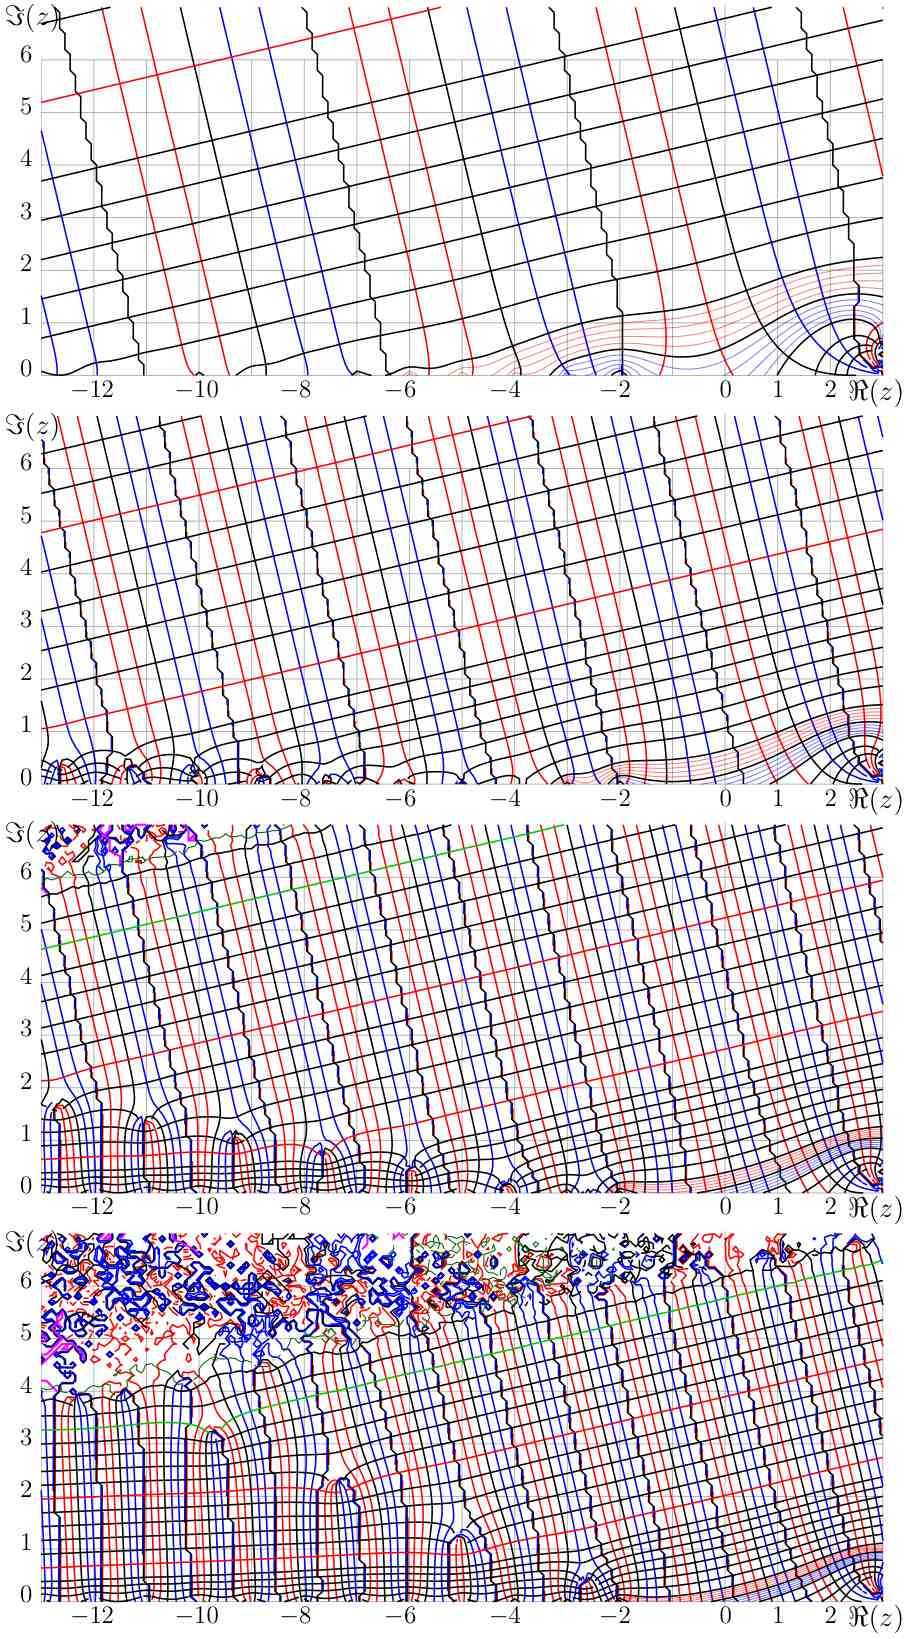 | 907 × 1,639 (268 KB) | Maintenance script (talk | contribs) | == Summary == Importing file |
You cannot overwrite this file.
File usage
The following 2 pages use this file: