File:ContourPlotExample.jpg: Difference between revisions

From Citizendium
Jump to navigation Jump to search
imported>Caesar Schinas
m (Robot: Automated text replacement (-{{CC-by-1.0}} +{{CC|by|1.0}}))
(== Summary == Importing file)
Tag: Server-side upload
 
(One intermediate revision by one other user not shown)
Line 1: Line 1:
== Summary ==
== Summary ==
{{Image notes
Importing file
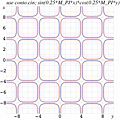
|Description=Example of [[contour plot]] . Function <math>
f(x,y)=
\sin\left(\frac{\pi}{4}x\right)
\sin\left(\frac{\pi}{4}y\right) </math> is plotted in the range
<math>-10\le x\le 10~</math>,
<math>-10\le y\le 10~</math>.
Levels <math>f(x,y)=-0.1</math> are shown wiht red lines.
Levels <math>f(x,y)= 0.1</math> are shown wiht blue lines.
After to generate the eps file, the image was converted to jpg format.
|Author= Dmitrii Kouznetsov
|Date= 2008
|Source= [[Contour plot/Code]] (main program)
* [[Contour plot/Code/ado.cin]]    (function that makes header of the eps file)
* [[Contour plot/Code/conto.cin]]  (function which draws a level)
|Country first published in= Japan
|Copyright holder= Dmitrii Kouznetsov
|Notes= This is just an example of a [[contour plot]] to illustrate the article. However, the source may have an independent use, but you have to edit it; replace the test function mentioned above to your function you would like to plot. Feel free to download, to execute, to distribute and modify the source as you need.
Please, indicate the source and modifications (if any) if you distribute it.
|Other versions=}}
 
<!-- {{attribution}} !-->
 
== Licensing/Copyright status ==
{{CC|by|1.0}}

Latest revision as of 18:52, 11 March 2022

Summary

Importing file

File history

Click on a date/time to view the file as it appeared at that time.

Date/TimeThumbnailDimensionsUserComment
current18:52, 11 March 2022Thumbnail for version as of 18:52, 11 March 2022448 × 448 (24 KB)Maintenance script (talk | contribs)== Summary == Importing file

Metadata