Receiver operating characteristic curve: Difference between revisions
imported>Robert Badgett No edit summary |
imported>Robert Badgett No edit summary |
||
| Line 1: | Line 1: | ||
{{subpages}} | {{subpages}} | ||
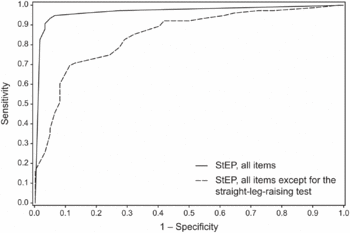
{{Image|Journal.pmed.1000047.g006.gif|right|350px|ROC curves for the distinction between radicular and axial [[lumbalgia|LBP]] based on StEP. The difference in area under the solid curve compared to the dashed curve is the value of adding the [[straight leg raise]] test.}} | |||
In [[statistics]] and [[diagnostic test]]s, the '''receiver operating characteristic curve''', also called '''ROC curve''', is a "graphic means for assessing the ability of a screening test to discriminate between healthy and diseased persons; may also be used in other studies, e.g., distinguishing stimuli responses as to a faint stimuli or nonstimuli."<ref>{{MeSH}}</ref> | In [[statistics]] and [[diagnostic test]]s, the '''receiver operating characteristic curve''', also called '''ROC curve''', is a "graphic means for assessing the ability of a screening test to discriminate between healthy and diseased persons; may also be used in other studies, e.g., distinguishing stimuli responses as to a faint stimuli or nonstimuli."<ref>{{MeSH}}</ref> | ||
Revision as of 19:22, 20 May 2010

In statistics and diagnostic tests, the receiver operating characteristic curve, also called ROC curve, is a "graphic means for assessing the ability of a screening test to discriminate between healthy and diseased persons; may also be used in other studies, e.g., distinguishing stimuli responses as to a faint stimuli or nonstimuli."[1]
Area under the ROC curve
The area under the ROC curve, called the AUC, AROC, c statistic, or c-index may measure discriminatory ability of a test of model. The c-index varies from 0 to 1 and a result of 0.5 indicates that the diagnostic test does not add to guessing.[2] If the diagnostic test gives ratings that are continuous, the AUC is the same as the Wilcoxon test of ranks (also called the Mann–Whitney U test).[2] Accordingly, the AROC is the probability that the diagnostic test will correctly order the likelihood of disease among two patients randomly selected from a test population.
Variations have been proposed.[3][4]
References
- ↑ Anonymous (2024), Receiver operating characteristic curve (English). Medical Subject Headings. U.S. National Library of Medicine.
- ↑ 2.0 2.1 Hanley JA, McNeil BJ (April 1982). "The meaning and use of the area under a receiver operating characteristic (ROC) curve". Radiology 143 (1): 29–36. PMID 7063747. [e]
Cite error: Invalid
<ref>tag; name "pmid7063747" defined multiple times with different content - ↑ Walter SD (July 2005). "The partial area under the summary ROC curve". Stat Med 24 (13): 2025–40. DOI:10.1002/sim.2103. PMID 15900606. Research Blogging.
- ↑ Bangdiwala SI, Haedo AS, Natal ML, Villaveces A (September 2008). "The agreement chart as an alternative to the receiver-operating characteristic curve for diagnostic tests". J Clin Epidemiol 61 (9): 866–74. DOI:10.1016/j.jclinepi.2008.04.002. PMID 18687288. Research Blogging.