File:Relative Volatility vs T&P.png: Difference between revisions
Jump to navigation
Jump to search
imported>Milton Beychok ({{Image notes |Description=Diagram of the effect of temperature or pressure on relative volatility |Author= Milton Beychok |Date=July 20, 2008 |Source=I drew this myself using Microsoft's Paint program |Country first published in=United States |Copyright holder=Milton Beychok |Notes= |Other versions=}}) |
imported>Milton Beychok (uploaded a new version of "Image:Relative Volatility vs T&P.png": {{Image notes |Description= Diagram of the effect of temperature or pressure on relative volatility |Author= Milton Beychok |Date= April 8, 2009 |Source= I drew it myself |Country first published in= United States |Copyright holder= Milton Beychok |Notes= This is an updated version of the diagram I originally uploaded. |Other versions=}}) |
(No difference)
| |
Revision as of 14:22, 8 April 2009
Summary
Licensing/Copyright status
| This work, Relative Volatility vs T&P.png, is hereby released into the Public Domain. To view a copy of the public domain dedication, visit http://creativecommons.org/licenses/publicdomain/. |

|
In the event such a release is not possible, the author has stipulated that his/her Work may, in perpetuity, and without attribution, be freely reproduced, distributed, transmitted, used, modified, built upon, or otherwise exploited by anyone for any purpose, commercial or non-commercial, and in any way, including by methods that have not yet been invented or conceived. |
File history
Click on a date/time to view the file as it appeared at that time.
| Date/Time | Thumbnail | Dimensions | User | Comment | |
|---|---|---|---|---|---|
| current | 19:52, 11 March 2022 | 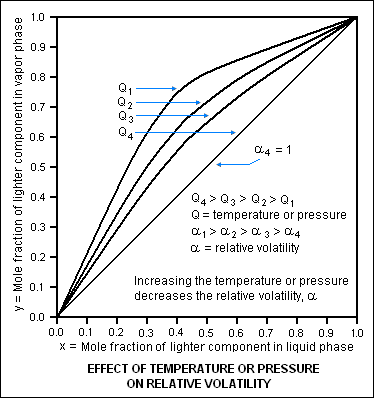 | 374 × 398 (14 KB) | Maintenance script (talk | contribs) | == Summary == Importing file |
You cannot overwrite this file.
File usage
The following 3 pages use this file: