Great Depression in the United States/Tutorials
Jump to navigation
Jump to search

Depression Data[1] 1929 1931 1933 1937 1938 1940 Real Gross National Product (GNP) 1 101.4 84.3 68.3 103.9 103.7 113.0 Consumer Price Index 2 122.5 108.7 92.4 102.7 99.4 100.2 Index of Industrial Production 2 109 75 69 112 89 126 Money Supply M2 ($ billions) 46.6 42.7 32.2 45.7 49.3 55.2 Exports ($ billions) 5.24 2.42 1.67 3.35 3.18 4.02 Unemployment (% of civilian work force) 3.1 16.1 25.2 13.8 16.5 13.9
1 in 1929 dollars
2 1935-39 = 100

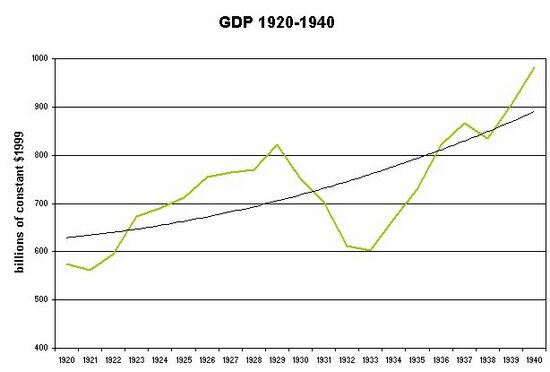
Chart 1: GDP annual pattern and long-term trend, 1920-40, in billions of constant dollars[2]